The industrial control system (ICS) used in this scenario simulates an environment that might be used to cool industrial equipment. The ICS is made up of five systems. The first system contains a tank, tank level sensor and a water pump. The second system is a programmable logic controller (PLC) which controls the water pump based on the level of water found in the attached tank. The third system is an Open Platform Communications (OPC) server which accesses and modifies data found on the PLC. The fourth system is running Human Machine Interface (HMI) software which communicates with the OPC server to provide a human system operator with system statistics and control. The final system in the ICS is a security appliance that provides routing and firewall services for all systems.
This scenario also makes use of a system running Kali Linux running the Wireshark network monitoring software. In this lab only the security appliance, PLC and Kali systems are used. In this lab the virtual network switch is configured so that the Kail system receives all data transmitted. (Network diagram)
In this lab you are going to use Wireshark to capture and view typical network traffic. You will observe that Wireshark can present captured data in multiple formats. You will use Wireshark display filters to limit the traffic shown to only that which interests you. Finally, you will use Wireshark's follow stream functionality to demonstrate how to collect, decode and view related network traffic in a single window.
Part 1
Install Systems
In this part of the lab you are going to install and configure the systems needed to complete the lab.
Login a second time to the nlstu-s1.nl.northweststate.edu remote server using your assigned username and password.
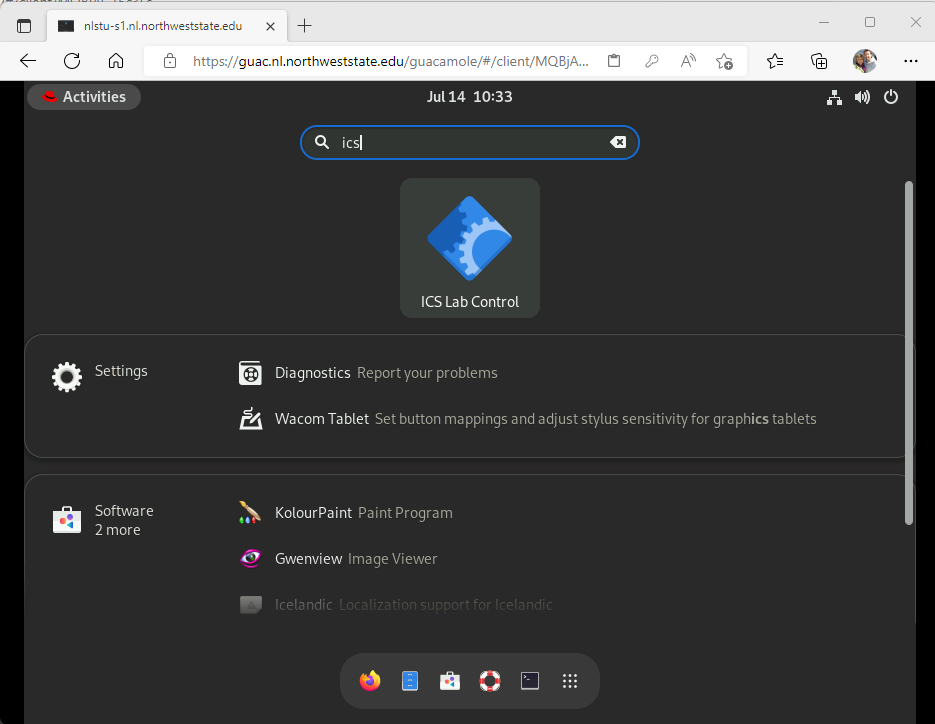
When the Linux desktop appears, click the Activities menu located in the top left hand corner of the screen.
Type ics into the Type to search field that appears in the top center of the screen (Example).
Click the ICS Lab Control icon.
Select the New Lab option, click the OK button then wait for the systems to start.
Part 2
Login to Kali and activate the network device connected to the manufacturing network
In this part of the lab you are going to login to the Kali system, view the system's IP address, bring up its second network card then start the ping program to generate typical network traffic.
Access the Kali system.
At the login screen enter student into the Enter your username field and Password01 into the Enter your password field.
Click the Log In button.
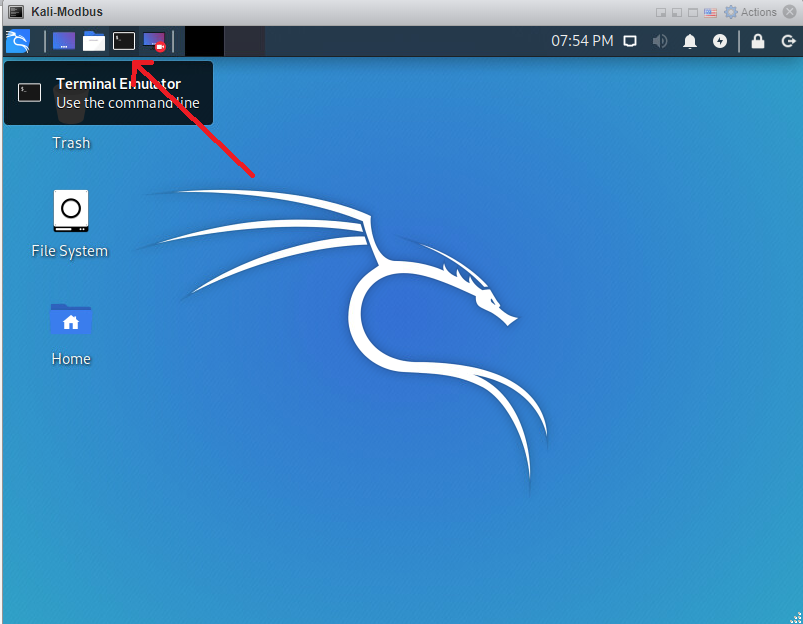
Open a terminal (command prompt) window by clicking the Terminal Emulator button found at the upper left hand corner of the window (Example).
Type the command nmcli connection to view the available network connections.
Notice that the Cell-Area Zone configuration is associated with a device but the Manufacturing Zone configuration is not.
Type the letter q to stop viewing the network configurations.
Switch the zone (network segment) that the Kali system is connected to by typing the command ~/change_network.sh then providing the student user's password, Password01 when prompted.
To prevent people from looking over your shoulder and writing down the password it is not displayed on the screen as you are typing.
View the available network configurations by typing the command nmcli connection.
Notice that now the Manufacturing Zone configuration is associated with a device but the Cell-Area Zone configuration is not.
Type the letter q to stop viewing the network configurations.
If you restart the Kali system at any point during this lab you will need to redo this section of the lab instructions.
Part 3
Use Wireshark to capture and view network traffic in different formats
In this part of the lab you are going to use the Wireshark network monitoring software to capture and view typical network data.
Type the command ping 10.0.105.1 to generate typical ICMP network traffic.
Open a new tab in the Terminal Emulator program by going to the File menu then choosing the option + New Tab
Start the Wireshark program by typing the command sudo wireshark
If you are using sudo and are prompted to authenticate type in the password Password01 followed by the <ENTER> key.
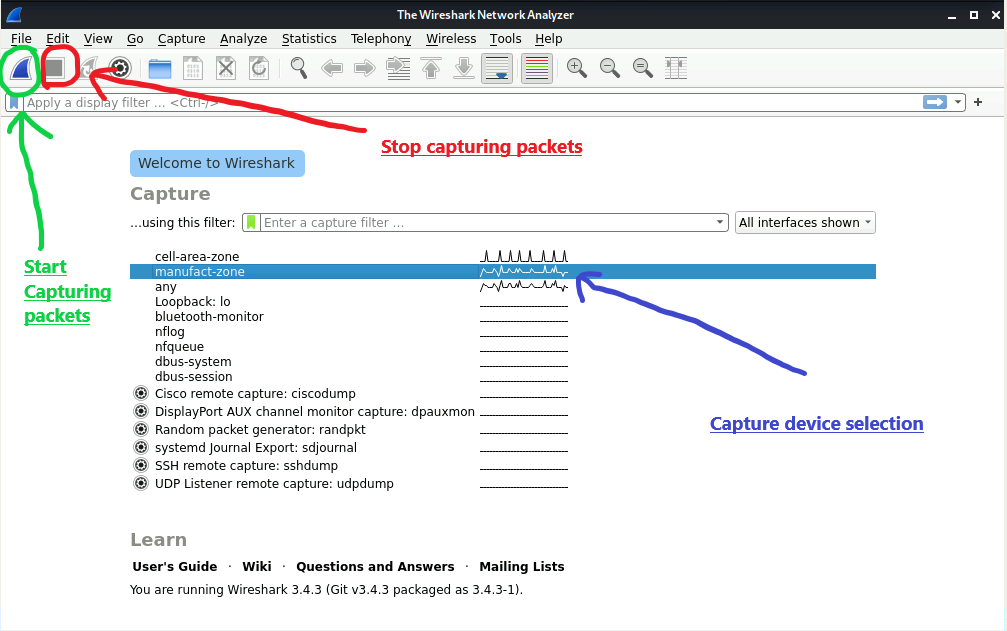
After the Wireshark program starts select the manufact-zone network device to indicate that you wish to capture data on that device (Example).
Click the Start Capturing packets button to begin capturing network data (Example).
Let the system capture data for about 1 minute.
Click the Stop Capturing packets button to stop capturing network data (Example).
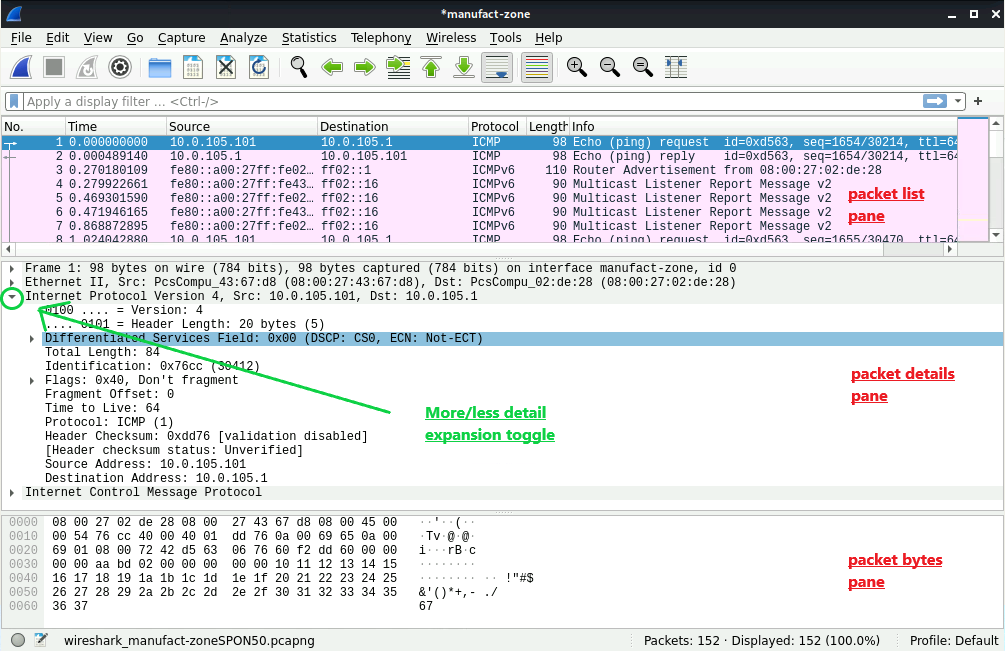
Scroll through the list of packets in the top, packet list, pane and observe the type of data shown (Example).
You should see that the data is ordered, contains a time stamp in relation to when the capture started, IP addressing information, the protocol being used, length of the packet and an overview of the data contained in the packet.
Scroll through the list of packets in the middle, packet details, pane and observe the type of data shown (Example).
In the packet details pane you will see detailed and decoded information about the packet selected in the packet list pane.
You can expand and contract categories shown in the packet detail pane to view more or less detailed data regarding that category.
Scroll through the list of packets in the bottom, packet bytes, pane and observe the type of data shown (Example).
The packet bytes pane shows the raw binary data shown in hexadecimal format.
The packet bytes pane automatically highlights the raw data associated with any decoded detail data selected in the packet detail pane.
Note that you can use the bar separating the packet list, packet details and packet bytes panes to resize the pane and control how much data is shown in each pane.
Part 4
Use Wireshark filters to display specific data
In this part of the lab you are going to use Wireshark display filters to limit the traffic shown to only what is needed.
Start capturing network traffic by clicking on the Start Capturing packets button then clicking the Continue without Saving button.
Open a new terminal (command prompt) window by clicking the Terminal Emulator button found at the upper left hand corner of the window.
Release the IP address assigned by the DHCP protocol to the manufact-zone network card by typing the command sudo dhclient -r manufact-zone
The dhclient program is a program used on Linux systems to interact with DHCP servers.
The -r switch tells the dhclient to release any IP addresses assigned by DHCP.
The manufact-zone argument indicates the network card that should be used.
Request a new IP address for the manufact-zone network card by typing the command sudo dhclient manufact-zone
Type the command exit to end the terminal session.
Return to the Wireshark window.
Stop capturing network traffic by clicking on the Stop Capturing packets button.
Scroll through the packet list pane and find a packet that is using the DHCP protocol.
Note that just scrolling through all data to find a specific packet can be time consuming and cumbersome.
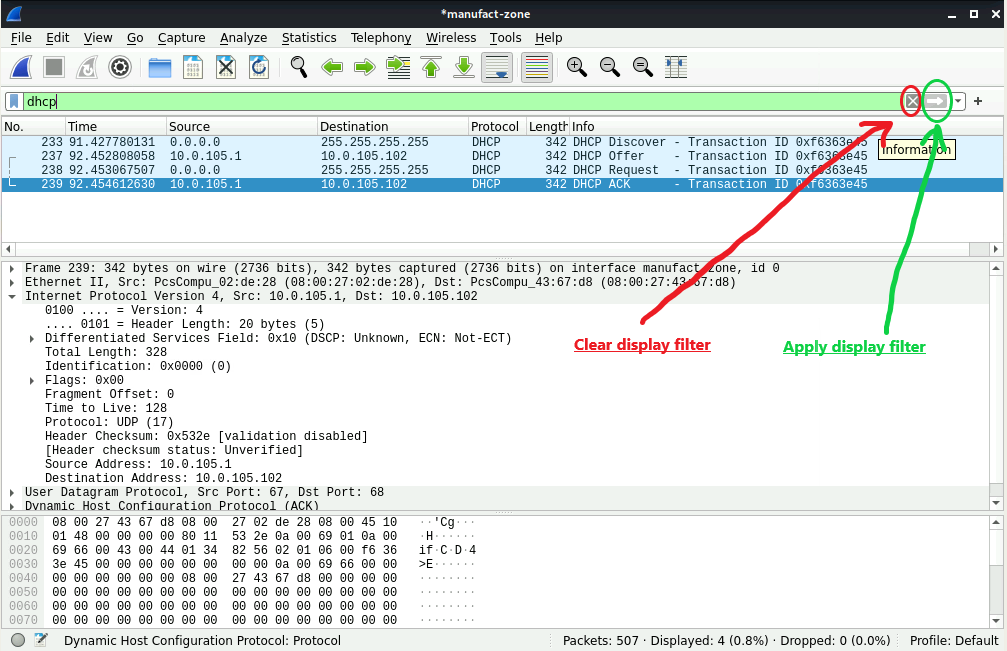
Click in the display filter field, type dhcp then click the Apply display filter button or press <ENTER> to activate the filter (Example).
Note that now the only packets shown in the packet list are those using the DHCP protocol.
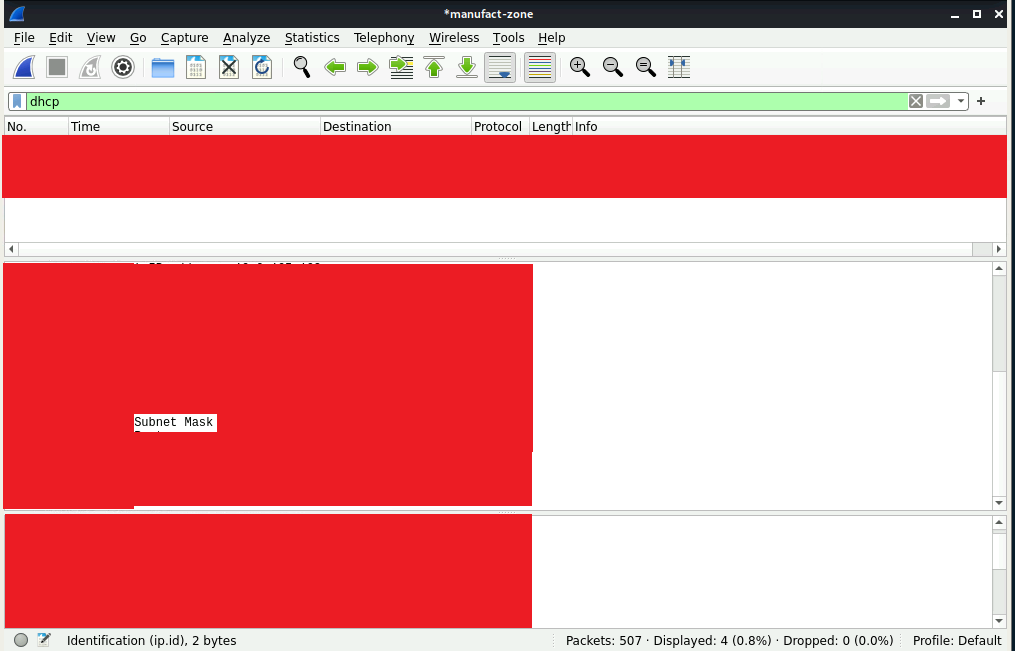
Use the data displayed in Wireshark to determine what Subnet Mask has been assigned by DHCP.
Take a screen shot that shows, in Wireshark, the Subnet Mask was assigned by DHCP (Example) and paste it into the Wireshark Lab Form found here.
Part 5
Use Wireshark's protocol follow stream option to capture plain text data
In this part of the lab, you will use Wireshark's follow stream functionality to demonstrate how to collect, decode and view related network traffic in a single window.
Click the Clear display filter button to remove the current display filter (Example).
Start capturing network traffic by clicking on the Start Capturing packets button then clicking the Continue without Saving button.
Open a new terminal (command prompt) window by clicking the Terminal Emulator button found at the upper left hand corner of the window.
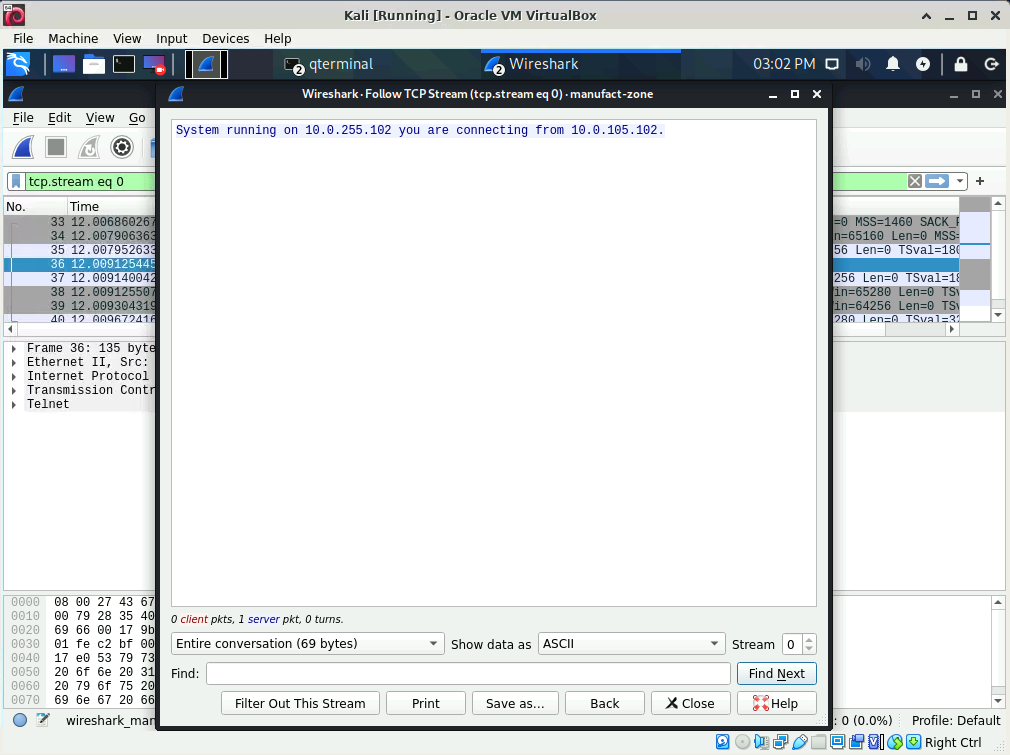
Connect to the PLC by typing the command nc 10.0.255.102 23
The nc command starts the netcat program which is useful network utility that allows a quick connection to network services. In this case netcat is connecting to the telnet service running on the PLC.
Type the command exit to end the terminal session.
Return to the Wireshark window.
Stop capturing network traffic by clicking on the Stop Capturing packets button.
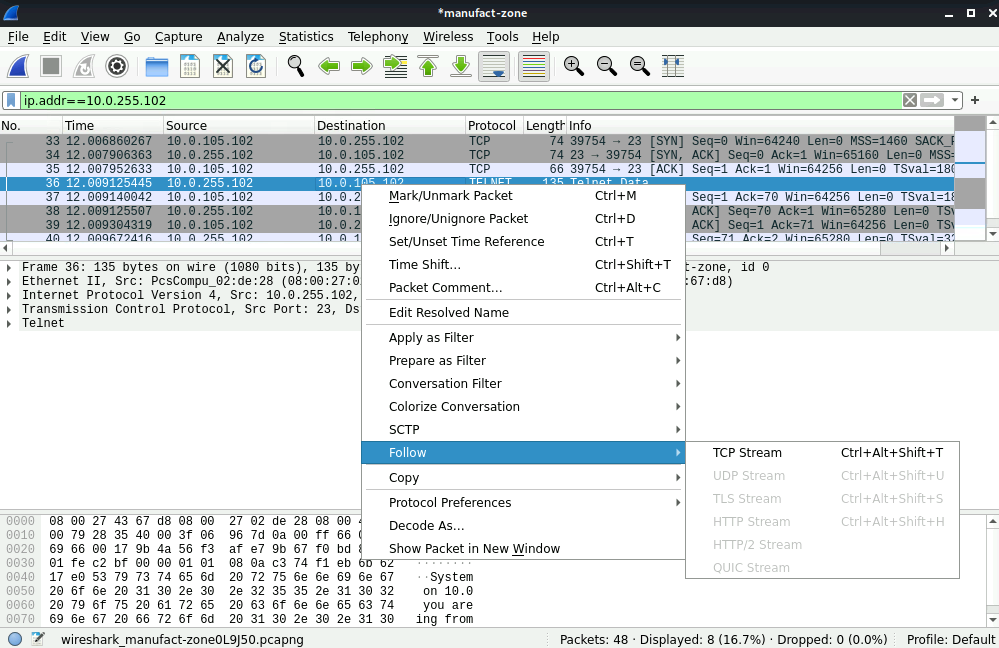
Click in the display filter field, type ip.addr==10.0.255.102 then click the Apply display filter button or press <ENTER> to activate the filter (Example).
Right click any packet in the packet list pane which is using the TELNET protocol.
From the pop up menu choose the option Follow -> TCP Stream (Example).
Part 6
Use Wireshark to analyze a previously saved data capture
In this part of the lab, you will use Wireshark to analyze a pcap data file which contains a connection to a web server using the HTTP and HTTPS protocols.
Close the Follow TCP Stream window
Click the Clear display filter button to remove the current display filter (Example).
From the File menu in Wireshark choose the Open option.
Navigate to the /home/student/labs/wireshark directory then open the Wireshark-Lab.pcapng capture file.
Click the Continue without Saving button.
Create and apply a display filter which will show only http traffic.
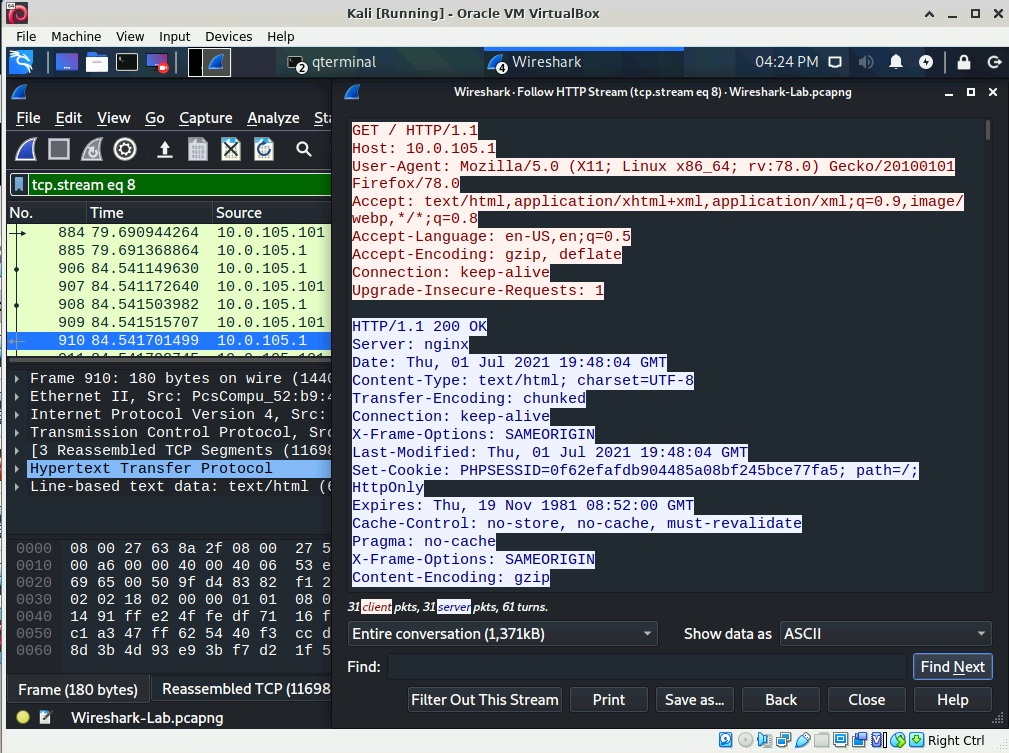
Use the follow HTTP Stream option to follow the stream associated with any of the filtered packets going to or coming from the IP address 10.0.105.1 which also uses the HTTP protocol.
Make certain to follow the HTTP protocol and not the OCSP protocol.
Take a minute or two and view the data displayed.
Ensure that some data from the http stream is shown, take a screen shot that shows the entire Kali window (Example) and paste it into the Wireshark Lab Form found here.
Close the Follow HTTP Stream window.
Remove the current display filter.
Create and apply a display filter which will show only traffic associated with HTTPS traffic using TCP port 443.
The filter you should use is tcp.port==443
Use the follow TCP Stream option to follow the stream associated with any of the filtered packets going to or coming from the IP address 10.0.105.1 which also uses the TCP protocol.
To end the lab, restart the ICS Lab Control program from the Desktop if necessary, select the Pause/End Lab option, click the OK button then wait for the systems to stop.